Protein quantification is an essential part of many protein biology workflows and is a necessary step prior to commonly used techniques such as protein electrophoresis, western blotting, mass spectrum, and immunoassays. Compared with traditional colorimetric methods such as BCA and Bradford, the fluorescence method has a wider dynamic range and higher accuracy.
Fluorescent protein assay kits are highly selective for proteins and can also be highly accurate in the presence of reducing reagents. The kit can not only be tested on a general-purpose fluorometer, but also can be tested on a microplate reader with fluorescence function.
Reagents and Instruments
•Qubit™ Protein Assay Kits (Thermo: Q33212)
•Qubit 4 Fluorometer (Thermo)
•Fluo-200 Fluorometer (ALLSHENG)
•Feyond-A300 Multi-mode Microplate Reader (ALLSHENG)
Method
•Standard Preparation
Sample volume | 10μL |
Standard preparation | The highest concentration of 400ng/uL protein standard in the kit was diluted to prepare 6 concentrations of 300, 200, 100, 50, 25, 12.5ng/uL, and the kit concentration ranged from 12.5 µg/mL to 5 mg/mL. |
•Steps
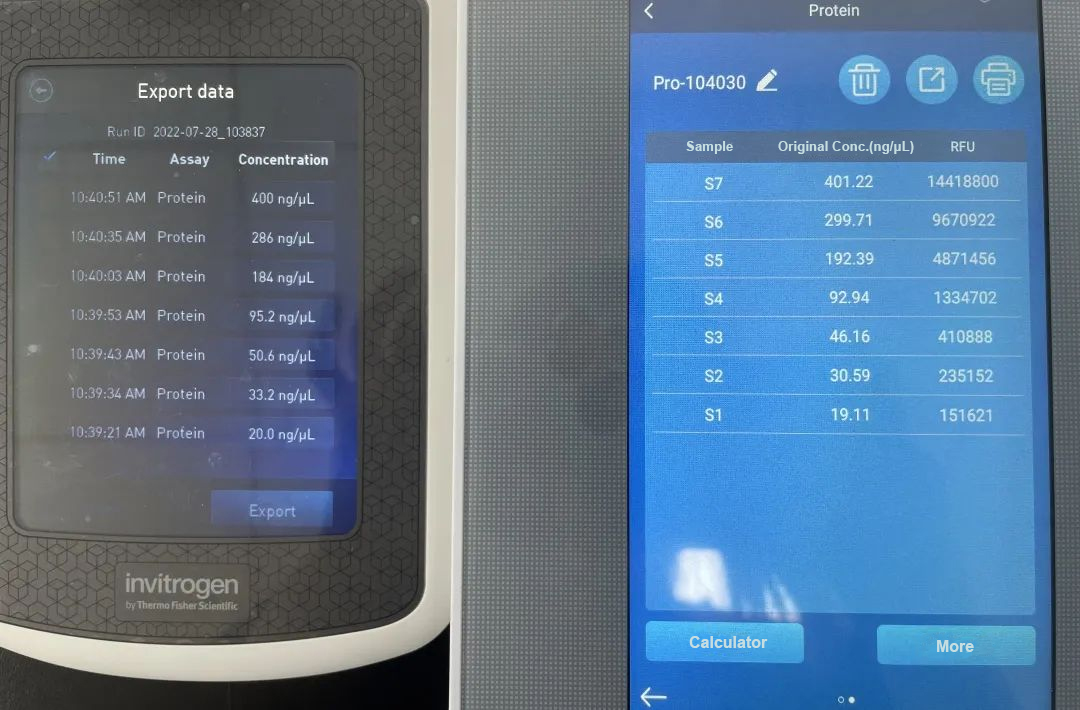
(1) According to the reagent instructions, prepare dye Mix working solution and 0, 200 and 400ng/uL calibration point reagents. After the calibration curve is completed, detect on Qubit4 and Fluo-200 respectively.
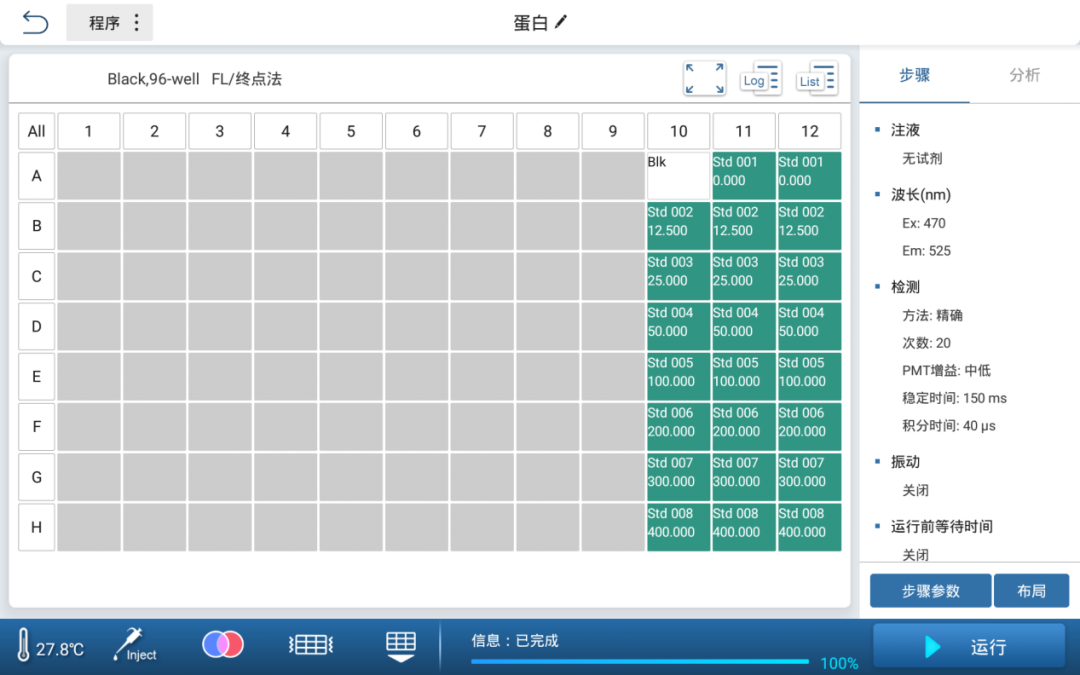
(2) After adding 10uL of standard solution to each well of a 96-well black flat-bottom microplate, add 190uL of Mix working solution to each well, mix well and protect from light for 5 minutes, then start the instrument detection, the standard and blank layout are shown in Figure 1, the instrument parameters are shown in Table 1.
Table 1 Feyond-A300 Parameter Setting
Reagent wavelength | EX/EM: 470/525 |
PMT gain | Medium low |
Stabilization time | 150ms |
Integration time | 40μs |
Figure 1 Sample Layout Interface
Result
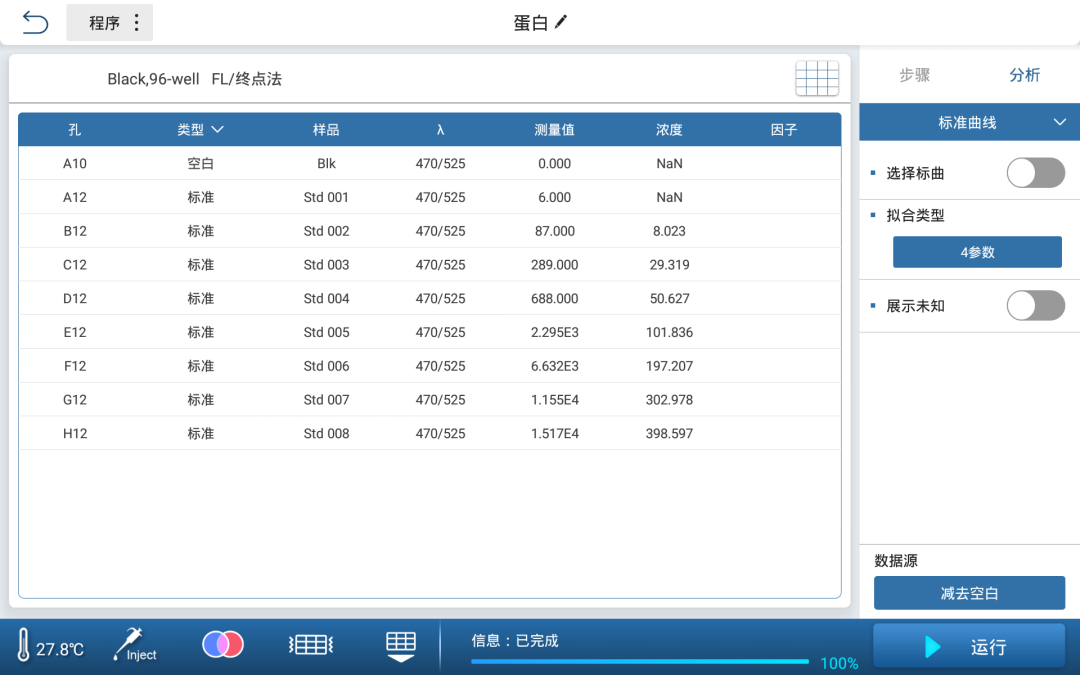
(1) Using the built-in data processing software of Feyond-A300, the standard curve fitting of the protein standard concentration and the fluorescence intensity, and the four-parameter (4PL) fitting method was used to obtain the curve equation and the curve fitting degree, and R2 was close to 1 (Fig. 2).
Figure 2. Protein Standard Curve

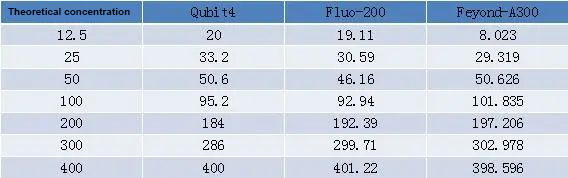
(2) When the concentration range is 12.5 ng/μL~400 ng/μL, the detection concentration deviation of Fluo-200 and Qubit4 is within 10%, which is a reasonable deviation of Qubit. Except for the lowest point close to the limit concentration, the detected concentration of Feyond-A300 was also within a reasonable deviation compared with Qubit4, and was closer to the theoretical concentration (Table 2).
Table 2 Test Data of the Three Instruments
Summary
Qubit fluorescence detection protein kit is not only applicable to Qubit instruments, but also applicable to the fluorescence detection function of Feyond-A300, and the accuracy is basically the same. The fluorometer detection does not need to establish a standard curve, only needs to calibrate the standard points, and the concentration can be directly tested, which is simple and convenient. Feyond-A300 standard curve storage function can also meet this requirement. After establishing a standard curve once, save the standard curve in the standard curve library, and then only need to retrieve the standard curve to directly give the concentration of the unknown sample.

 Biological Sample Preparation
 Life Science Detection Products
 POCT Detection & Reagent
 Automation & Liquid Handling
 Laboratory Instrument
 Reagent & Consumable
 Others
 OEM/ODM


 Release time:2022-09-14
 Source:
 Pageviews:4424


 + 86 571-88859758
 sales@allsheng.com


